Problems tagged with "computing loss"
Problem #007
Tags: computing loss
Consider the data set shown below. The ``\(\times\)'' points have label +1, while the ``o'' points have label -1. Shown are the places where a linear prediction function \(H\) is equal to zero, 1, and -1.
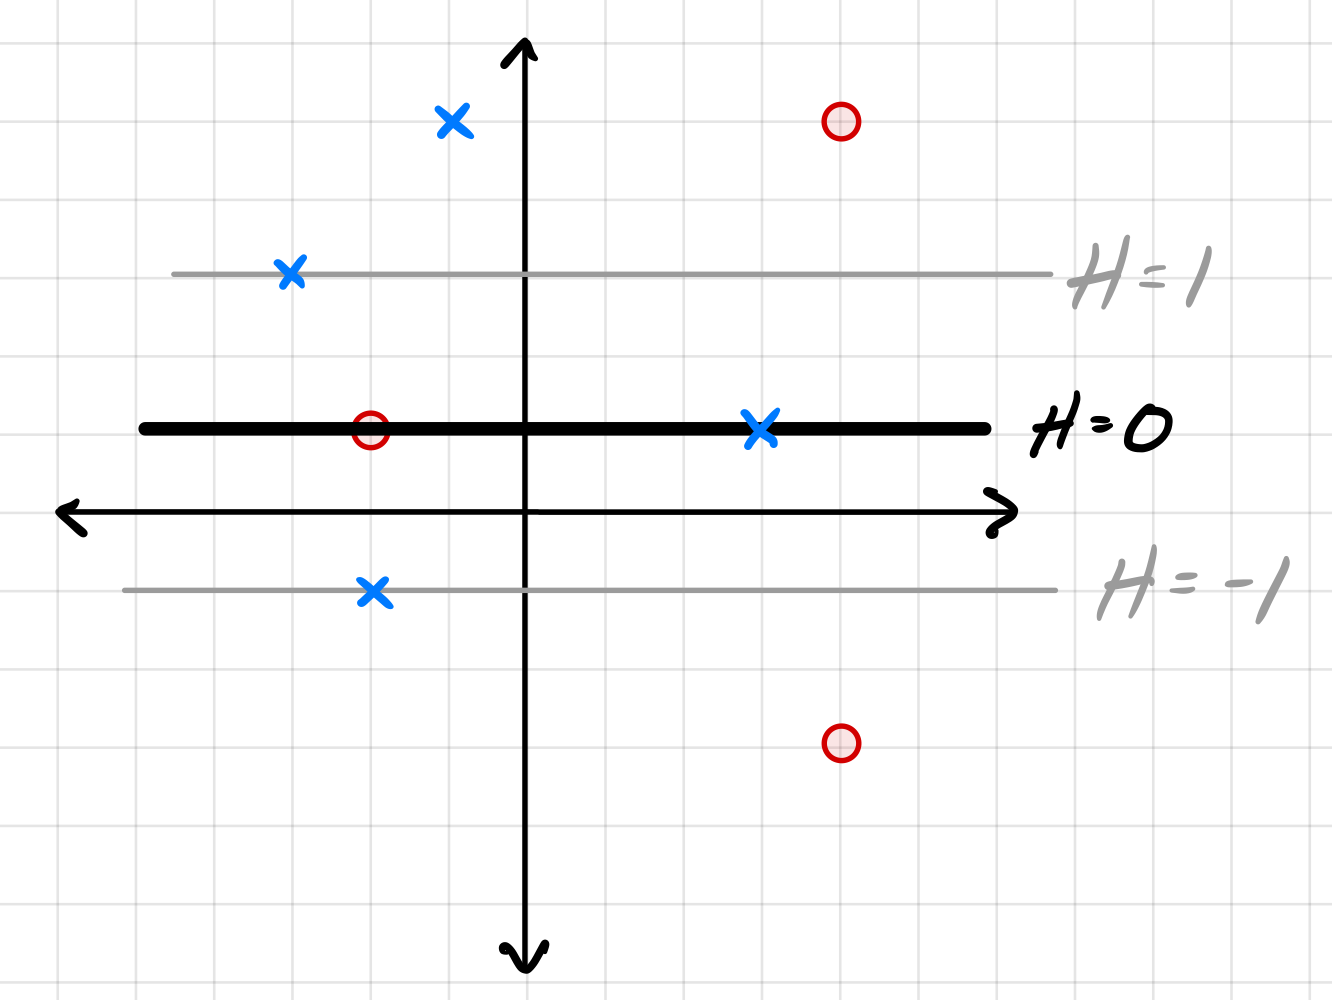
For each of the below subproblems, calculate the total loss with respect to the given loss function. That is, you should calculate \(\sum_{i=1}^n L(\nvec{x}{i}, y_i, \vec w)\) using the appropriate loss function in place of \(L\). Note that we have most often calculated the mean loss, but here we calculate the total so that we encounter fewer fractions.
Part 1)
What is the total square loss of \(H\) on this data set?
Solution
17
Part 2)
What is the total perceptron loss of \(H\) on this data set?
Solution
3
Part 3)
What is the total hinge loss of \(H\) on this data set?
Solution
7
Problem #024
Tags: computing loss
Consider the data set shown below. The ``\(\times\)'' points have label -1, while the ``\(\circ\)'' points have label +1. Shown are the places where a linear prediction function \(H\) is equal to zero (the thick solid line), 1, and -1 (the dotted lines). Each cell of the grid is 1 unit by 1 unit.
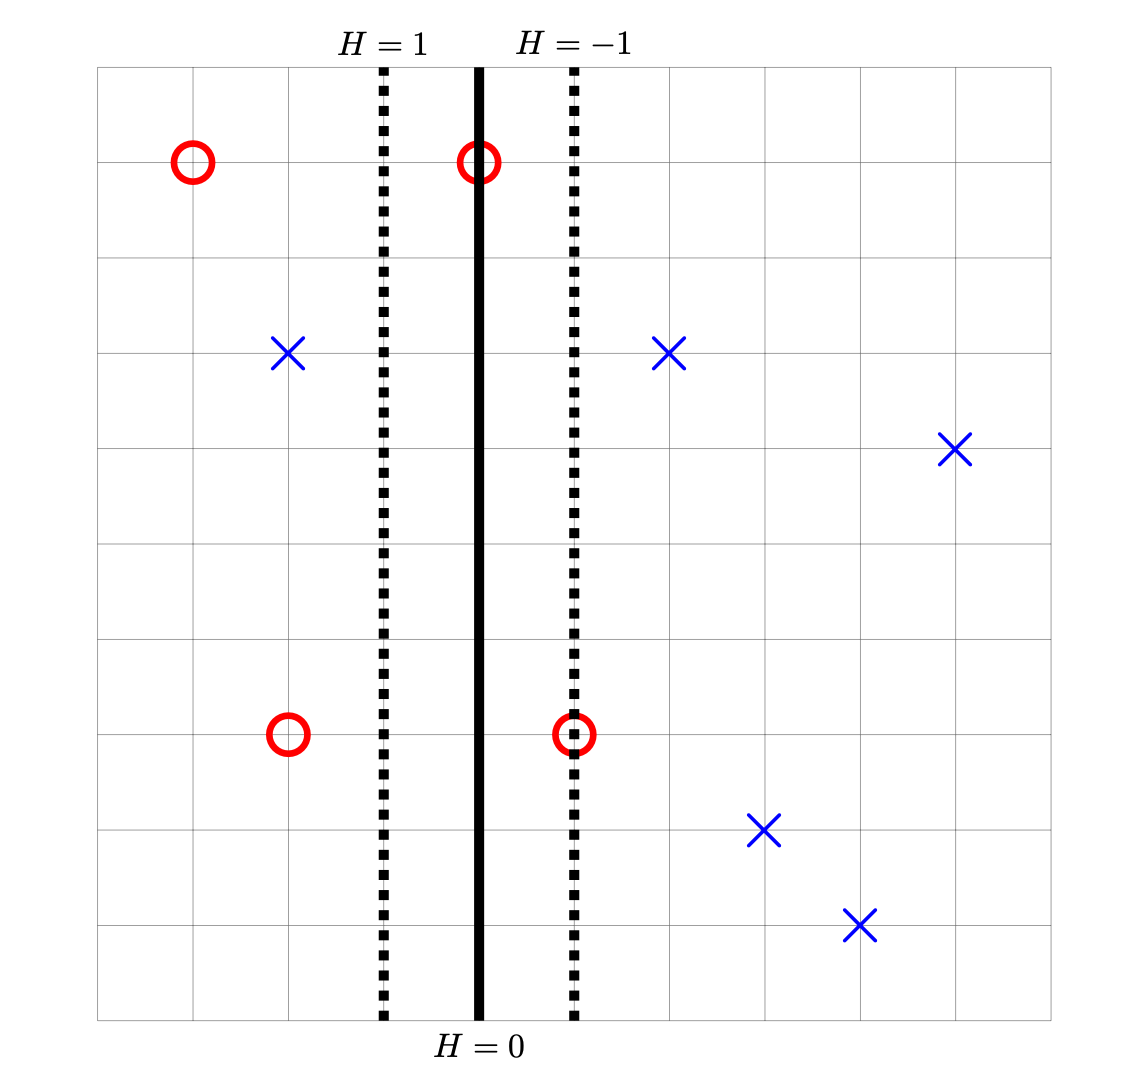
For each of the below subproblems, calculate the total loss with respect to the given loss function. That is, you should calculate \(\sum_{i=1}^n L(\nvec{x}{i}, y_i, \vec w)\) using the appropriate loss function in place of \(L\). Note that we have most often calculated the mean loss, but here we calculate the total so that we encounter fewer fractions.
Part 1)
What is the total square loss of \(H\) on this data set?
Solution
49
Part 2)
What is the total perceptron loss of \(H\) on this data set?
Solution
3
Part 3)
What is the total hinge loss of \(H\) on this data set?
Solution
6
Problem #066
Tags: computing loss
Consider the data set shown below. The 4 points marked with ``+'' have label +1, while the 3 ``\(\circ\)'' points have label -1. Shown are the places where a linear prediction function \(H\) is equal to zero (the thick solid line), 1, and -1 (the dotted lines). Each cell of the grid is 1 unit by 1 unit. The origin is not specified; it is not necessary to know the absolute coordinates of the data to complete this problem.
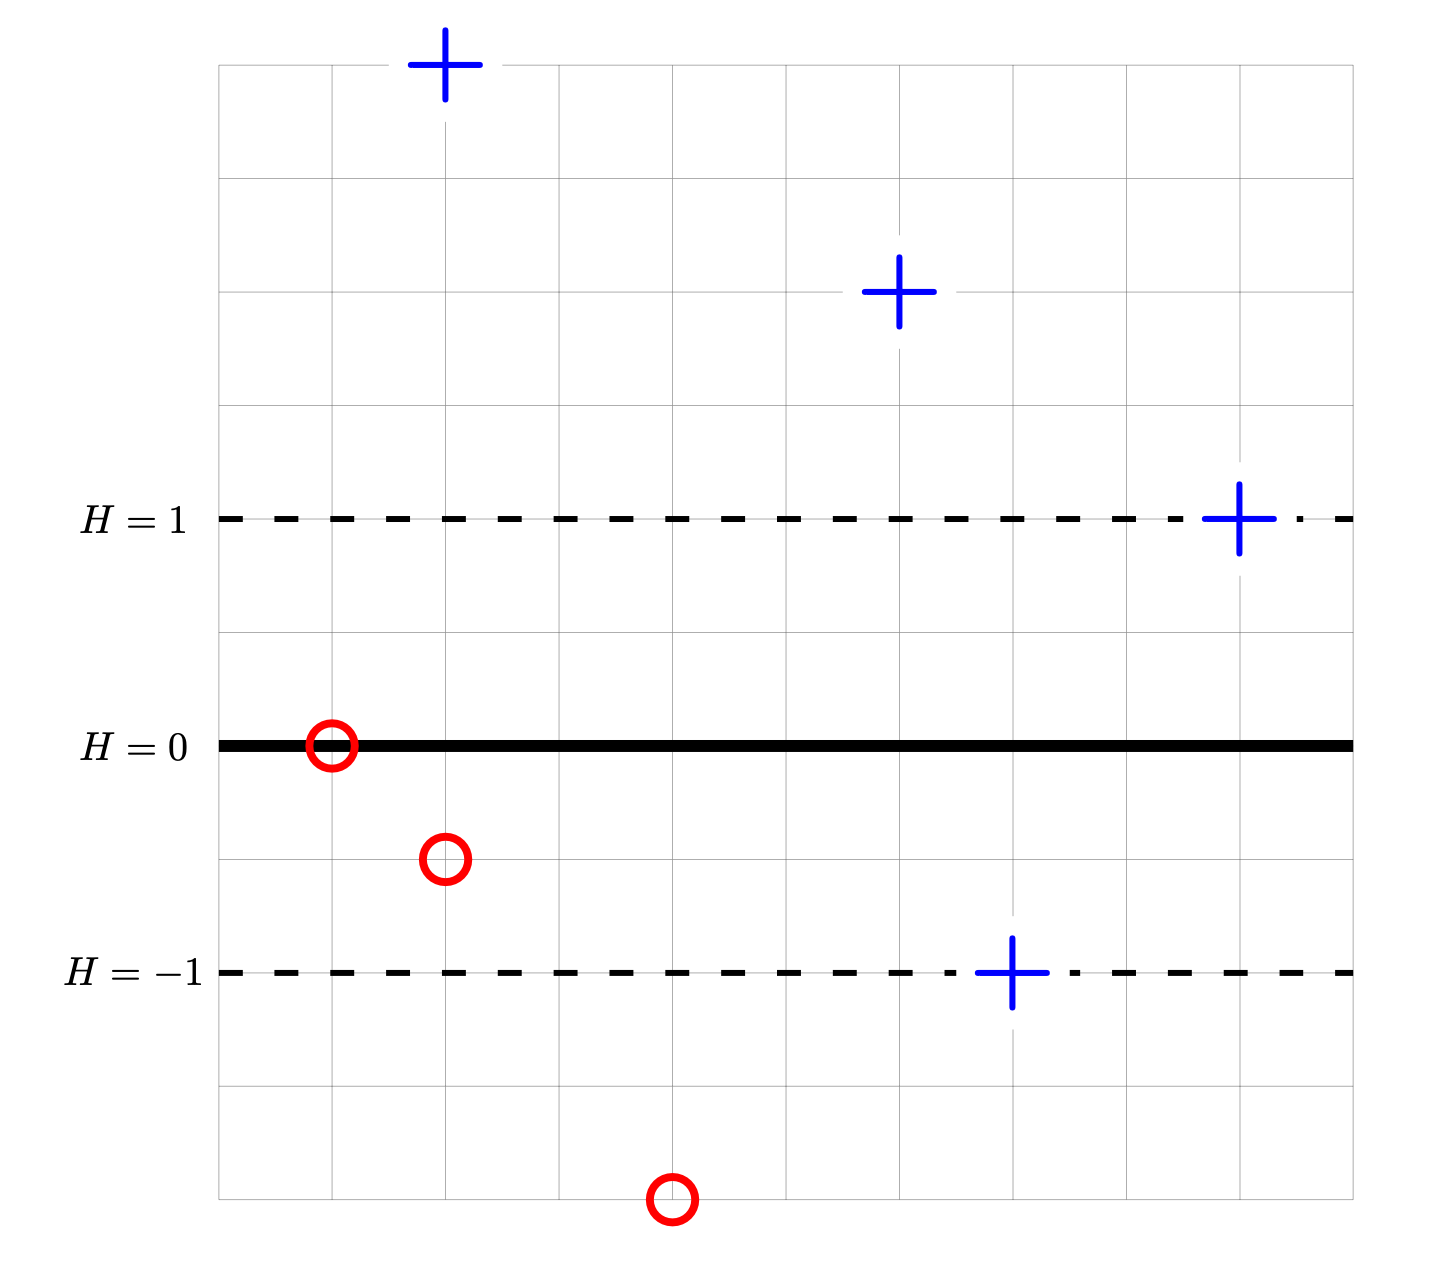
For each of the below subproblems, calculate the total loss with respect to the given loss function. That is, you should calculate \(\sum_{i=1}^n L(\nvec{x}{i}, y_i, \vec w)\) using the appropriate loss function in place of \(L\). Note that we have most often calculated the mean loss, but here we calculate the total so that we encounter fewer fractions.
Part 1)
What is the totalsquare loss of \(H\) on this data set?
Part 2)
What is the totalperceptron loss of \(H\) on this data set?
Part 3)
What is the totalhinge loss of \(H\) on this data set?
Problem #083
Tags: computing loss
Consider the data set shown below. The \(\diamond\) points marked with ``+'' have label +1, while the \(\circ\) points marked with ``\(-\)'' have label -1. Shown are the places where a linear prediction function \(H\) is equal to zero (the thick solid line), 1, and -1 (the dotted lines). Each cell of the grid is 1 unit by 1 unit. The origin is not specified; it is not necessary to know the absolute coordinates of the data to complete this problem.
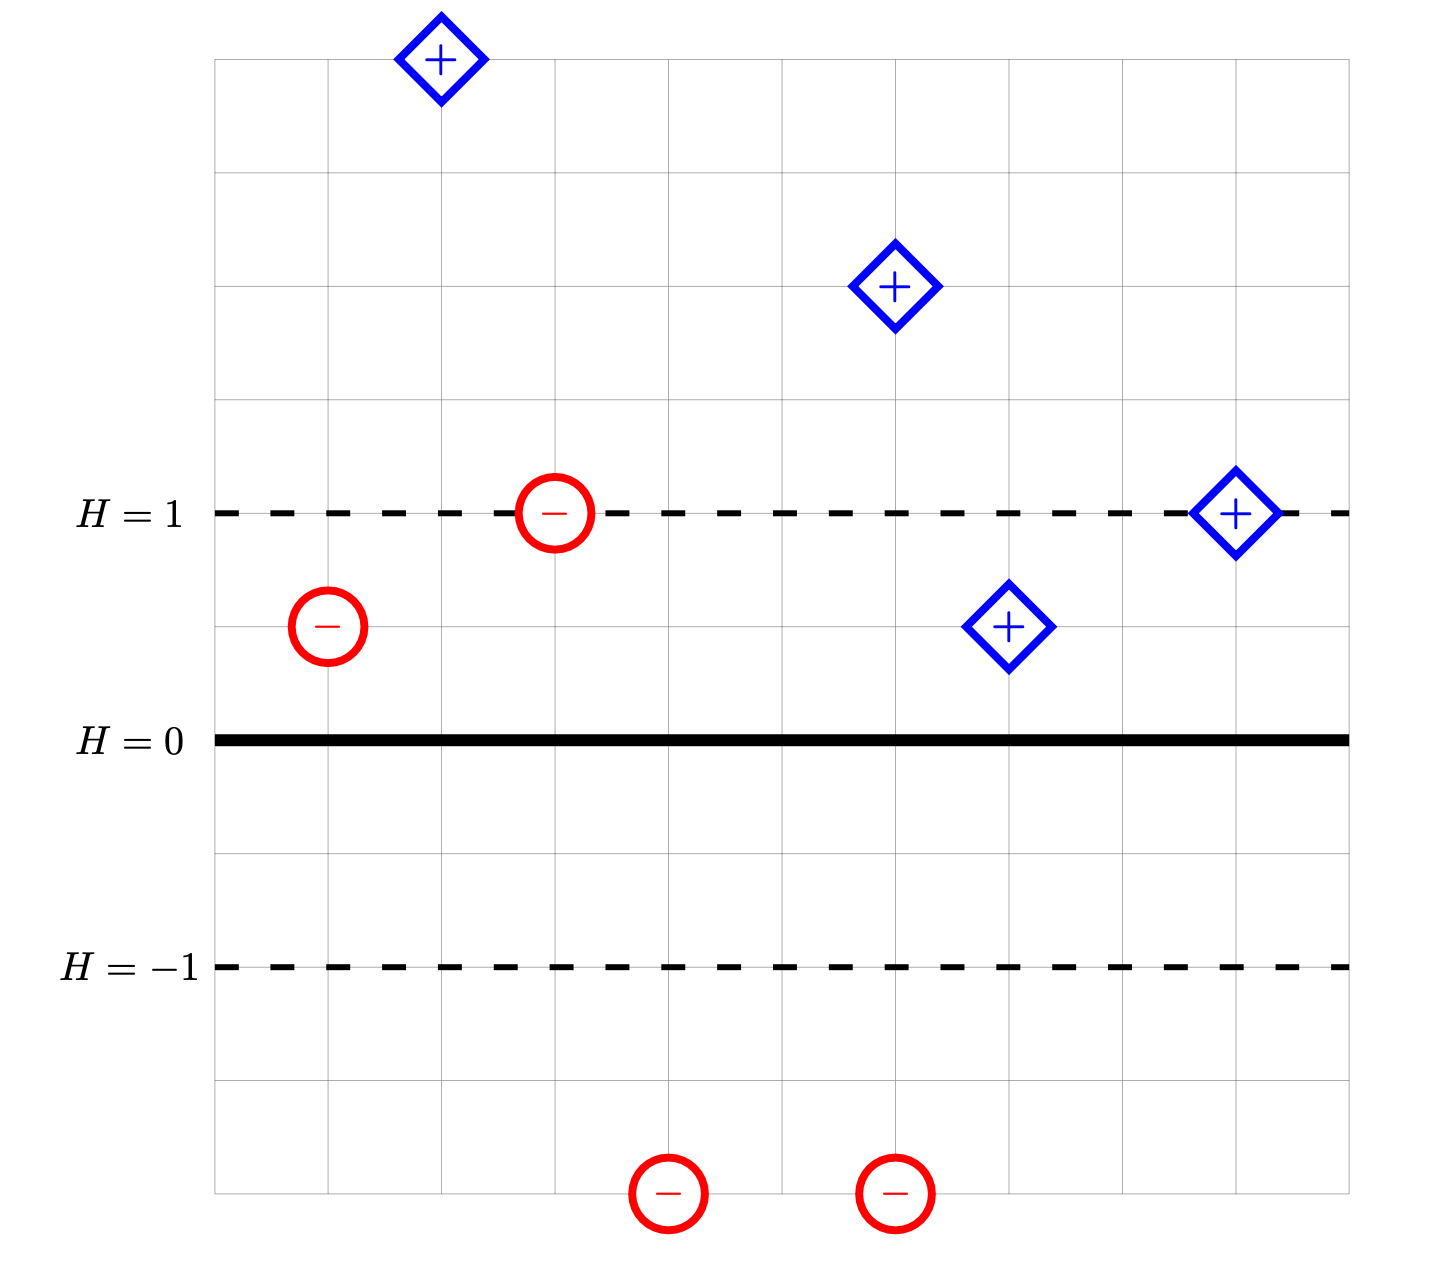
For each of the below subproblems, calculate the total loss with respect to the given loss function. That is, you should calculate \(\sum_{i=1}^n L(\nvec{x}{i}, y_i, \vec w)\) using the appropriate loss function in place of \(L\). Note that we have most often calculated the mean loss, but here we calculate the total so that we encounter fewer fractions.
Note: please double-check your calculations! We are not grading your work, so partial credit is difficult to assign on this problem.
Part 1)
What is the totalsquare loss of \(H\) on this data set?
Part 2)
What is the totalperceptron loss of \(H\) on this data set?
Part 3)
What is the totalhinge loss of \(H\) on this data set?